| The Nutritional Transition and Disease | ||||||||||||||||||||||||||||||||||||||||||||||||||||||||||||||||||||||||||||||||||||
| Shweta Rastogi | ||||||||||||||||||||||||||||||||||||||||||||||||||||||||||||||||||||||||||||||||||||
|
||||||||||||||||||||||||||||||||||||||||||||||||||||||||||||||||||||||||||||||||||||
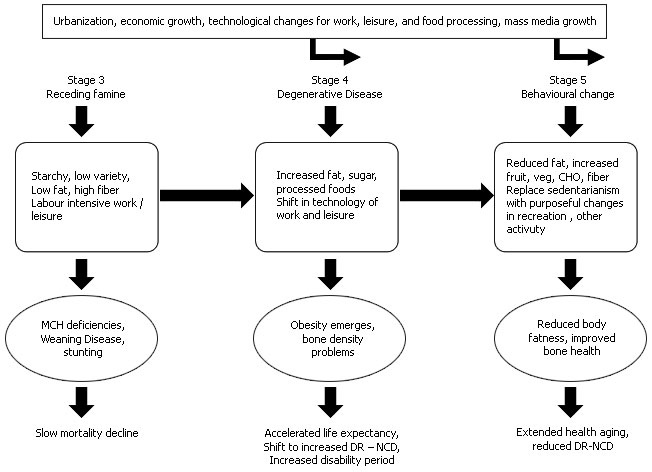
Two historic processes of change occur simultaneously with, or precede, the ‘nutrition transition’. One is the demographic transition-the shift from a pattern of high fertility and mortality to one of low fertility and mortality (typical of modern industrialized countries). The second is the epidemiological transition, first described by Omran. (Omran, 1971) The shift from a pattern of high prevalence of infectious disease-associated with malnutrition, periodic famine, and poor environmental sanitation-to one of high prevalence of chronic and degenerative disease-associated with urban industrial lifestyles. (Olshanky and Ault, 1986). |
||||||||||||||||||||||||||||||||||||||||||||||||||||||||||||||||||||||||||||||||||||
 |
||||||||||||||||||||||||||||||||||||||||||||||||||||||||||||||||||||||||||||||||||||
Dietary changes around the World are rapid The diets of the developing world are shifting rapidly, particularly with respect to fat, caloric sweeteners, and animal source foods (ASF). (Popkin, 2002; Popkin, 2003) (Table 1). Edible Oils Elsewhere we have provided evidence of the rapid increases in edible oil at the national and household level throughout the developing world. In many developing countries, dietary change has begun with major increases in domestic production and imports of oilseeds and vegetable oils-rather than animal source products or caloric sweeteners. For instance, between 1991 and 1996/7, global production of vegetable fats and oils rose from 60-71 million metric tons. In contrast, the production of visible animal fats (butter and tallow) has remained steady at approximately 12 million metric tons. Principal vegetable oils include soybean, sunflower, rapeseed, palm, and groundnut oil. With the exception of groundnut oil, global availability of each has approximately tripled between 1961 and 1990. With the broader macroeconomic shifts that affected this increase in edible vegetable fat intake-namely, edible vegetable fat prices, supply, and consumption-is unique because it affected rich and poor countries equally, the net impact is relatively much greater on low-income countries. (Drewnoswski and Popkin, 1997). Caloric Sweeteners Sugar is the world’s predominant sweetener. It is not clear exactly when sugar became the world’s principal sweetener-most likely in the 17th or 18th century-as the New World began producing large quantities of sugar at reduced prices. (Galloway and Sugar, 2000). In the last several decades, increasingly larger quantities of cereals (primarily maize) have been used to produce sweeteners derived from starch. The overall trends show a large increase in caloric sweetener consumed. In 2000, 306 kcal were consumed per person per day, about a third more than in 1962; caloric sweetener also accounted for a large share of both total energy and total carbohydrates consumed. Not surprisingly, we have shown that all measures of caloric sweetener increase significantly as gross national product (GNP) per capita of the country and urbanization increase. However, the interaction between income growth and urbanization is important. Cholesterol and Lipids The importance of saturated fat in elevating blood cholesterol levels has been widely demonstrated. In the seven countries study, () there was a significant positive correlation between saturated fat intake and blood cholesterol levels. Moreover, numerous controlled clinical studies have shown that both saturated fat and cholesterol raise blood cholesterol levels. A meta-analysis of randomized controlled trials evaluating the effects of Step 1 and Step 2 dietary interventions on plasma lipids and lipoproteins has reported that lowering saturated fat and cholesterol reduces total and LDL-C levels, by approximately 10 to 15 percent. The impact on cholesterol levels from dietary saturated fat and cholesterol has been quantified by the equations of Keys et al. and Hegsted et al. These equations show that for every 1 percent increase in energy intake from saturated fat, blood cholesterol levels increase approximately 2 mg/dl. The impact of dietary cholesterol is less. Weight reduction also decreases blood cholesterol levels. Table 1: Summary of strength of evidence on lifestyle factors and risk of developing cardiovascular diseases |
||||||||||||||||||||||||||||||||||||||||||||||||||||||||||||||||||||||||||||||||||||
|
||||||||||||||||||||||||||||||||||||||||||||||||||||||||||||||||||||||||||||||||||||
The dietary changes that characterize the “nutrition transition” include both qualitative and quantitative changes in the diet. The adverse dietary changes include shifts in the structure of the diet towards a higher energy density diet with a greater role for fat and added sugars in foods, greater saturated fat intake (mostly from animal sources), reduced intakes of complex carbohydrates and dietary fiber, and reduced fruit and vegetable intakes. These dietary changes are compounded by lifestyle changes that reflect reduced physical activity at work and during leisure time. Developments in the availability of dietary energy Food consumption expressed in kilocalories (kcal) per capita per day is a key variable used for measuring and evaluating the evolution of the global and regional food situation. A more appropriate term for this variable would be “national average apparent food consumption” since the data come from national Food Balance Sheets rather than from food consumption surveys. Analysis of FAOSTAT data shows that dietary energy measured in kcals per capita per day has been steadily increasing on a worldwide basis; availability of calories per capita from the mid-1960s to the late 1990s increased globally by approximately 450 kcal per capita per day and by over 600 kcal per capita per day in developing countries. This change has not, however, been equal across regions. The per capita supply of calories has remained almost stagnant in sub-Saharan Africa and has recently fallen in the countries in economic transition. In contrast, the per capita supply of energy has risen dramatically in East Asia (by almost 1000 kcal per capita per capita per day, mainly in China) and in the Near East/ North Africa region (by over 700 kcal per capita per day) (Table 2). |
||||||||||||||||||||||||||||||||||||||||||||||||||||||||||||||||||||||||||||||||||||
| Table 2: Global and regional per capita food consumption (kcal per capita per day) |
||||||||||||||||||||||||||||||||||||||||||||||||||||||||||||||||||||||||||||||||||||
|
||||||||||||||||||||||||||||||||||||||||||||||||||||||||||||||||||||||||||||||||||||
| *Excludes South Africa. From FAO, 2002 | ||||||||||||||||||||||||||||||||||||||||||||||||||||||||||||||||||||||||||||||||||||
| In short, it would appear that the world has made significant progress in raising food consumption per person. The increase in the world average consumption would have been higher but for the declines in the transition economies that occurred in the 1990s. It is generally agreed, however, that those declines are likely to revert in the near future. The growth in food consumption has been accompanied by significant structural changes and a shift in diet away from staples such as roots and tubers towards more livestock products and vegetables oils. Table 3 shows that current energy intakes range from 2681 kcal per capita per day in developing countries, to 2906 kcal per capita per day in transition countries and 3380 kcal per capita per day in industrialized countries. Data shown in Table suggest that per capita energy supply has declined from both animal and vegetable sources in the countries in economic transition, while it has increased in the developing and industrialized countries. | ||||||||||||||||||||||||||||||||||||||||||||||||||||||||||||||||||||||||||||||||||||
| Table 3: Vegetable and animal sources of energy in the diet (kcal per capita per day) |
||||||||||||||||||||||||||||||||||||||||||||||||||||||||||||||||||||||||||||||||||||
|
||||||||||||||||||||||||||||||||||||||||||||||||||||||||||||||||||||||||||||||||||||
| T, Total kcal; V, kcal of vegetable origin; A, kcal of animal origin (including fish products). Source: FAOSTAT, 2003 | ||||||||||||||||||||||||||||||||||||||||||||||||||||||||||||||||||||||||||||||||||||
The total fish supply and hence consumption has been growing at a rate of 3.6% per year since 1961, while the world’s population has been expanding at 1.8% per year. The proteins derived from fish, crustaceans and mollusks account for between 13.8% and 16.5% of the animal protein intake of the human population. The average apparent per capita consumption increased from about 9 kg per year in the early 1960s to 16 kg in 1997. The per capita availability of fish and fishery products has therefore nearly doubled in 40 years, outpacing population growth. As well as income-related variations, the role of fish in nutrition shows marked continental, regional and national differences. In industrialized countries, where diets generally contain a more diversified range of animal proteins, a rise in per capita provision from 19.7 kg to 27.7 kg seems to have occurred. This represents a growth rate close to 1% per year. In this group of countries, fish contributed an increasing share of total protein intake until 1989 (accounting for between 6.5% and 8.5%), but since then its importance has gradually declined and, in 1997, its percentage contribution was back to the level prevailing in the mid-1980s. In the early 1960s, per capita fish supply in low –income food-deficit countries was, on average, only 30% of that of the richest countries. This gap has been gradually reduced, such that in 1997, average fish consumption in these countries was 70% of that of the more affluent economies. Despite the relatively low consumption by weight in low-income food-deficit countries, the contribution of fish to total animal protein intake is considerable (nearly 20%). Over the past four decades, however, the share of fish proteins in animal proteins has declined slightly, because of faster growth in the consumption of other animal products. Globally, the share of dietary energy supplied by cereals appears to have remained relatively stable over time, representing about 50% of dietary energy supply. Recently, however, subtle changes appear to be taking place. A closer analysis of the dietary energy intake shows decrease in developing countries, where the share of energy derived from cereals has fallen from 60% to 54% in a period of only 10 years. Much of this downward trend is attributable to cereals, particularly wheat and rice, becoming less preferred foods in middle-income countries such as Brazil and China, a pattern likely to continue over the next 30 years or so. Fig. Shows the structural changes in the diet of developing countries over the past 30-40 years and FAO’s projections to the year 2030. (FAO, 2002). Availability and changes in consumption of dietary fat The increase in the quantity and quality of the fats consumed in the diet is an important feature of nutrition transition reflected in the national diets of countries. There are large variations across the regions of the world in the amount of total fats (i.e. fats in foods, plus added fats and oils) available for human consumption. The lowest quantities consumed are recorded in Africa, while the highest consumption occurs in parts of North America and Europe. The important point is that there has been a remarkable increase in the intake of dietary fats over the past three decades and that this increase has taken place practically everywhere except in Africa, where consumption levels have stagnate. The per capita supply of fat from animal foods has increased, respectively, by 14 and 4 g per capita in developing and industrialized countries, while there has been a decrease of 9 gms per capita in transition countries. |
||||||||||||||||||||||||||||||||||||||||||||||||||||||||||||||||||||||||||||||||||||
| Table 4: Fat consumption in various parts of the world | ||||||||||||||||||||||||||||||||||||||||||||||||||||||||||||||||||||||||||||||||||||
|
||||||||||||||||||||||||||||||||||||||||||||||||||||||||||||||||||||||||||||||||||||
| * Excludes South Africa. Source: FAOSTAT, 2003 | ||||||||||||||||||||||||||||||||||||||||||||||||||||||||||||||||||||||||||||||||||||
The increase in dietary fat supply worldwide exceeds the increase in dietary protein supply. The average global supply of fat has increased by 20 gms per capita per day since 1967-1969. This increase n availability has been most pronounced in the Americans, East Asia, and the European Community. The proportion of energy contributed by dietary fats exceeds 30% in the industrialized regions, and in nearly all other regions this share is increasing. The fat-to-energy ratio (FER) is defined as the percentage of energy derived from fat in the total supply of energy (in kcal). Country-specific analysis of FAO data for 1988-1990 (FAO, 1994) found a range for the FER of 7-46%. A total of 19 countries fell below the minimum recommendation of 35%, the majority of these countries been in North America and Western Europe. It is useful to note that limitations of the Food Balance Sheet data may contribute much of this variation in the FER between countries. For instance, in countries such as Malaysia with abundant availability of vegetable oils at low prices, Food Balance Sheet data may not reflect real consumption at the individual household level. In 1961-1963, a diet providing 20% of energy from fat was associated only with countries having at least a per capita gross national product of US $ 1475. By 1990, however, even poor countries having a gross national product of only US $ 750 per capita had access to a similar diet comprising 20% of energy from fat. (Both value of gross national product are given in 1993 US $). This change was mainly the result of an increase in the consumption of vegetable fats by poor countries, with smaller increases occurred in middle income and high-income countries. By 1990, vegetable fats accounted for a greater portion of dietary energy then animal fats for countries in the lowest per capita income category. Changes in edible vegetable oil supply, in prices and consumption equally affected rich and poor countries, although the net impact was relatively was much greater in low income countries. An equally large and important shift in the proportion of energy from added sugars in the diets of low-income countries was also a feature of the nutrition transition. (Drewnowski and Popkin, 1997). A variable proportion of these fat calories are provided by saturated fatty acids. Only in the two of the most affluent regions (i.e. in the parts of North America and Europe) is the intake of saturated fat at or above 10% of the energy intake level. In other less affluent countries, the proportion of dietary energy contributed by saturated fatty acids is lower, ranging from 5% to 8%, and generally not changing much over time. National dietary surveys conducted in some countries confirm these data. The ratio of dietary fat from animal sources to total fat is a key indicator, since foods from animal sources are high in saturated fat. Data sets used to calculate country-specific FERs can also be used to calculate proportions of animal fat in total fat. Such analysis indicated that the proportion of animal fat in total fat was lower than 10% in some countries (Democratic Republic of Congo, Mozambique, Nigeria, Sao Tome and Principe, and Sierra Leone), while it is above 75% in some other countries (Denmark, Finland, Hungary, Mongolia, Poland and Uruguay). These findings are not strictly divided along economic lines, as not all the countries in the high range represent the most affluent countries. Country-specific food availability and cultural dietary preferences and norms to some extent determine these patterns. The types of edible oils used in developing countries are also changing with the increasing use of hardened margarines (rich in trans fatty acids) that do not need to be refrigerated. Palm oil is becoming an increasingly important edible oil in the diets of much of South-East Asia and is likely to be a major source in the coming years. Currently, palm oil consumption is low and the FER ranges between 15% and 18%. At this low level of consumption, the saturated fatty acid content of the diet comprises only 4% to 8%. (WHO, 2002). |
||||||||||||||||||||||||||||||||||||||||||||||||||||||||||||||||||||||||||||||||||||
| Table 5: Per capita consumption of livestock products | ||||||||||||||||||||||||||||||||||||||||||||||||||||||||||||||||||||||||||||||||||||
|
||||||||||||||||||||||||||||||||||||||||||||||||||||||||||||||||||||||||||||||||||||
Availability and changes in consumption of animal products There has been an increasing pressure on the live stock sector to meet the growing demand for high value animal protein. The world’s livestock sector is growing at an unprecedented rate and the driving force behind this enormous surge is a combination of population growth, rising incomes and urbanizations. Annual meat production is projected to increase from 218 million tonnes in 1997-1999 to 376 million tonnes by 2030. There is a strong positive relationship between the level of income and the consumption of animal protein with the consumption of meat, milk and eggs increasing at the expense of staple foods. Because of recent steep decline in prices, developing countries are embarking on higher meat consumption at lower levels of gross domestic product than the industrialized countries did some 20-30 years ago. Urbanization is a major driving force influencing global demand for livestock product. Urbanization stimulates improvement in infrastructure, including cold chains, which permit trade in perishable goods. Compared with the less diversified diets of the rural communities, city dwellers have a varied diet which in animal proteins and fats, and characterized by higher consumption of meat, poultry, milk and other dairy products. Table 5 shows trends in per capita consumption of livestock products in different regions and country groups. There has been a remarkable increase in the consumption of animal products in countries such as Brazil and China, although the levels are still well below the levels of consumption in North American and most other industrialized countries. Availability and consumption of fruits and vegetables Consumption of fruits and vegetables plays a vital role in providing a diversified and nutritious diet. A low consumption of fruits and vegetables in many regions of the developing world is, however, a persistent phenomenon, confirmed by the findings of food consumption surveys. Nationally representative surveys in India, for example, indicate a steady level of consumption of only 120-140 g per capita per day, with about another 100 gms per capita coming from roots and tubers, and some 40 g per capita from pulses. This may not be true for urban populations in India, who have rising incomes and greater access to a diverse and varied diet. In contrast, in China, - a country that is undergoing rapid economic growth and transition – the amount of fruits and vegetables consumed has increased to 369 g per capita per day by 1992. At present, only a small and negligible minority of the world’s population consumes the generally recommended high average intake of fruits and vegetables. In 1998, only 6 of the 14 WHO regions had an availability of fruits and vegetables equal to or greater than the earlier recommended intake of 400 g per capita per day. The relatively favourable situation in 1998 appears to have evolved from a markedly less favourable position in previous years, as evinced by the great increase in vegetable availability recorded between 1990 and 1998 for most of the regions. In contrast, the availability of fruit generally decreased between 1990 and 1998 in most regions of the world. Diets in developing countries are changing as income rise. The share of staples, such as cereals, roots and tubers, is declining, while that of meat, dairy products and oil crops is rising. Between 1964-1966 and 1997-1999, per capita meat consumption in developing countries rose by 150% and that of milk and dairy products by 60%. By 2030, per capita consumption of livestock products could rise by a further 44%. Poultry consumption is predicted to grow the fastest. Productivity improvements are likely to be a major source of growth. In developing countries the demand is predicted to grow faster than production, resulting in growing trade deficit. In meat products this deficit will rise steeply from 1.2 million tonnes per year in 1997-1999 to 5.9 million tonnes per year in 2030 (despite growing meat exports from Latin America), while in case of milk and dairy products the rise will be less steep but still considerable, from 20 million tonnes per year in 1997-1999 to 39 million tonnes to 2030. An increasing share of livestock production will probably come from industrial enterprises. In recent years, production from this sector has grown twice as fast as that from more traditional from mixed farming systems and more than 6 times faster than that from grazing systems. |
||||||||||||||||||||||||||||||||||||||||||||||||||||||||||||||||||||||||||||||||||||
| All these issues and challenges in population nutrition need to be addressed in a pragmatic and intersectoral manner. All sectors in the food chain, from “farm to table” will need to be involved if the food system is to respond to the challenges posed by the need for changes in diets to cope with the burgeoning epidemic of non communicable diseases. | ||||||||||||||||||||||||||||||||||||||||||||||||||||||||||||||||||||||||||||||||||||
Available Volumes
| EDITOR IN CHIEF |
| Dr.
Rajeev Gupta (MD PhD FACC) |
| HON. EDITOR |
| Dr.
Soneil Guptha (MD FACC FESC) |
USEFUL LINKS |
 |